Redesigned profile experience boosts retention and drives $580K in revenue
Responsive Web
Account Redesign
User Research
I led a full-scale redesign of the user profile experience for a sweepstakes platform, turning a long-neglected part of the product into a key driver of growth and trust.
By collaborating with engineering, product, support, and legal, I introduced transparency around entry history and winner communication—solving core user pain points and reducing confusion.
The result: a 40% increase in sign-ups, 50% fewer support tickets, and $580K in incremental revenue in just two months.
This work became a foundational reason for the company's improved repeat rate year over year.
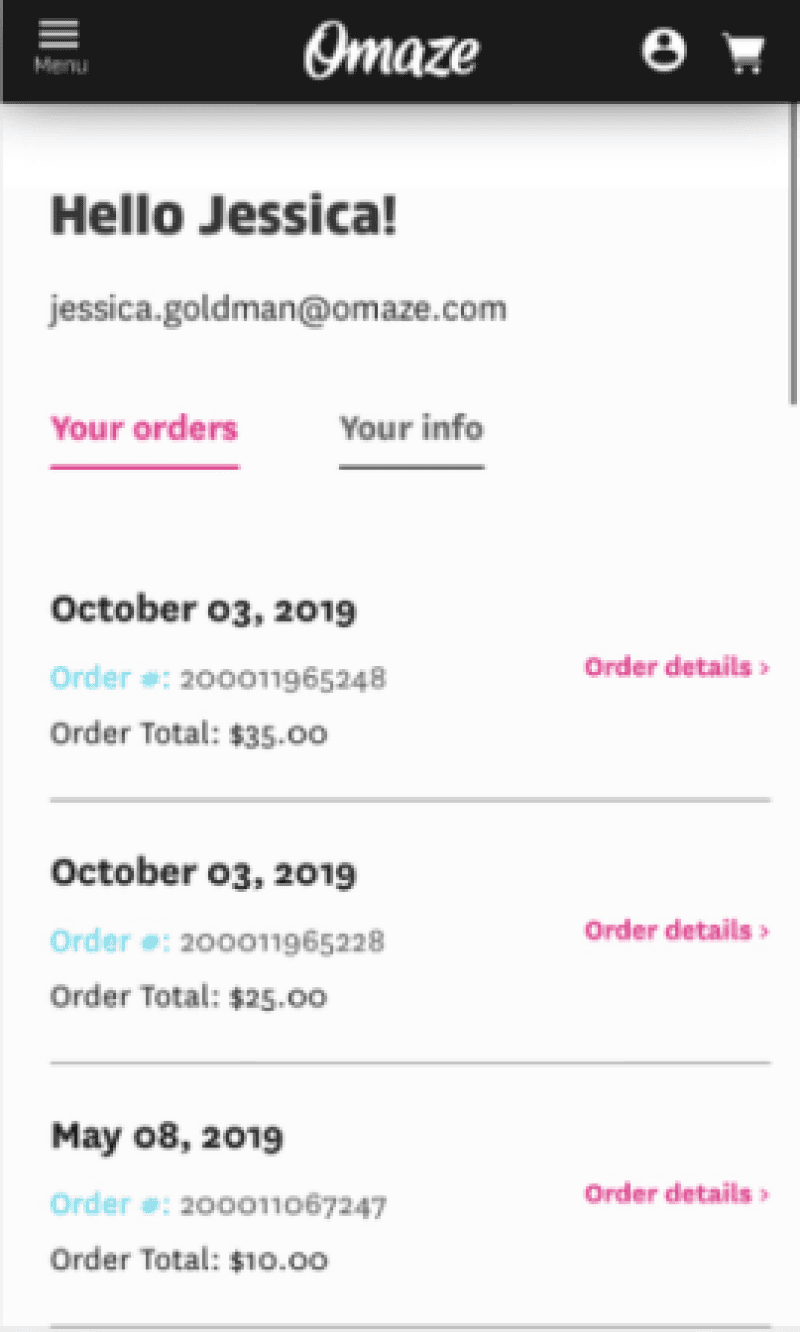
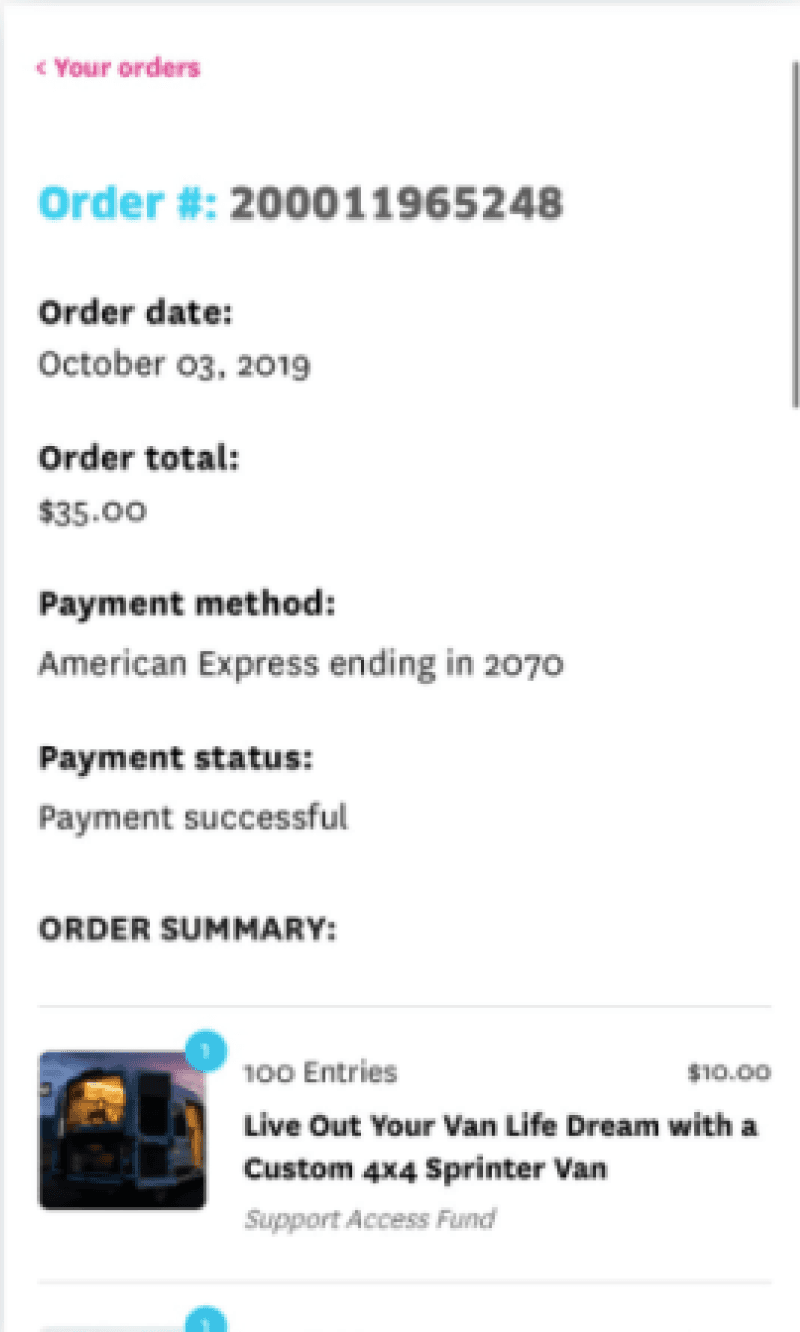
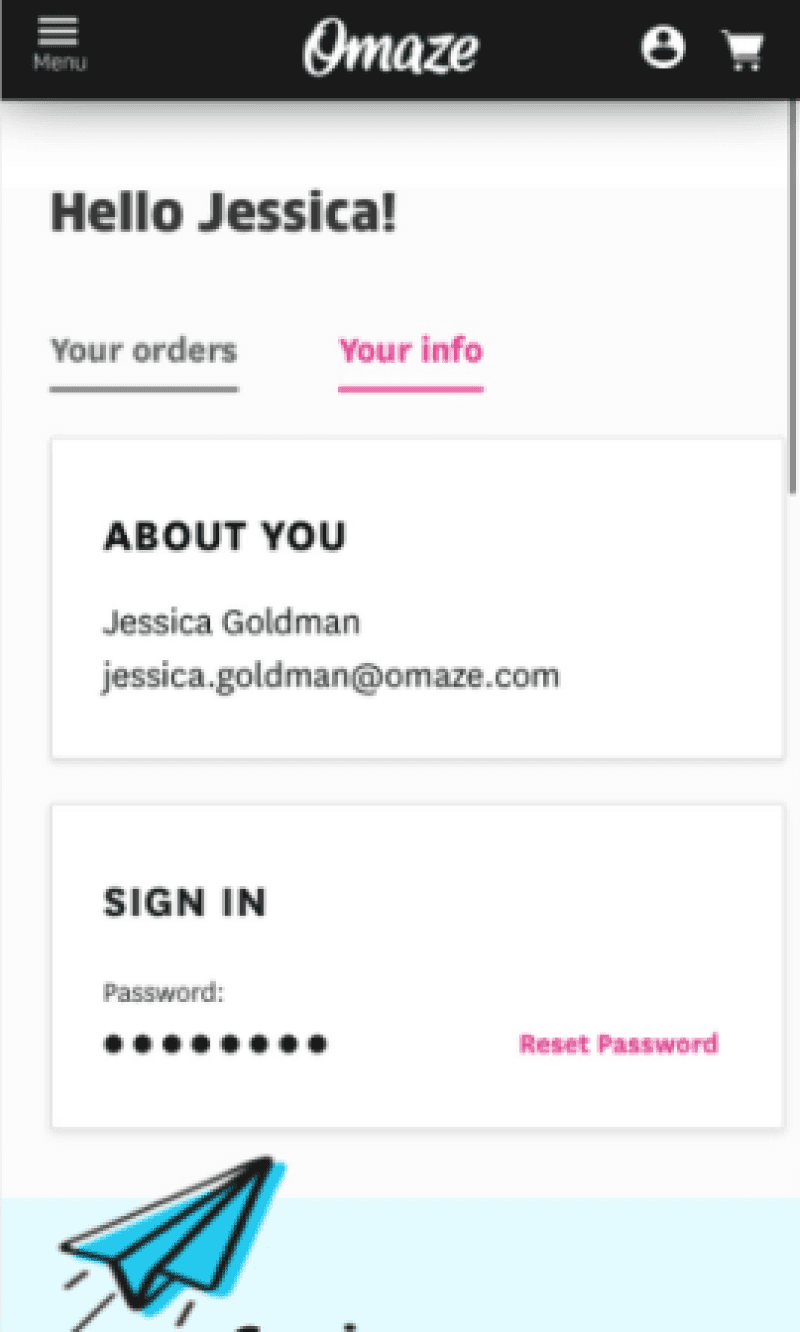
After migrating to Shopify, Omaze’s account experience became too transactional—like a generic e-comm checkout. It lacked clarity, trust, and user-centered design.
Key problems identified:
Users couldn’t track participation. Entry history, order status, and winner info were hard to find, leading to confusion.
Support tickets were piling up. The CX team was overwhelmed with account-related issues.
“There’s a grave lack of transparency. How much has the fundraiser raised in total? Where can I see…how many “entries” I’ve earned based on said donations?”
Omaze Customer, via a comment
“The lack of communication about winners and how many total entries were involved can be somewhat frustrating for a that have donated to many causes.”
Omaze Customer, via post-purchase survey
“I have been fantastically planning free entries on top of my very limited donations, and would love to see how many I have for each experience!”
Omaze Customer, via CX ticket
Analyze qualitative and quantitative insights
My hypothesis: Customers needed a simple dashboard to track sweepstakes entries, dates, and winner status—so they’d feel confident and re-engage.
What I did: I led surveys, interviews, and analysis to validate this, managing everything from sign-ups to synthesis. I presented the insights to execs, including the CMO and president, to get buy-in.
What I learned: Users didn’t know where to find results or track entries. This lack of clarity caused frustration and reduced trust.
How I focused the solution: I ran concept testing to de-scope the larger vision and prioritize what mattered most: transparency and clarity around entry status.
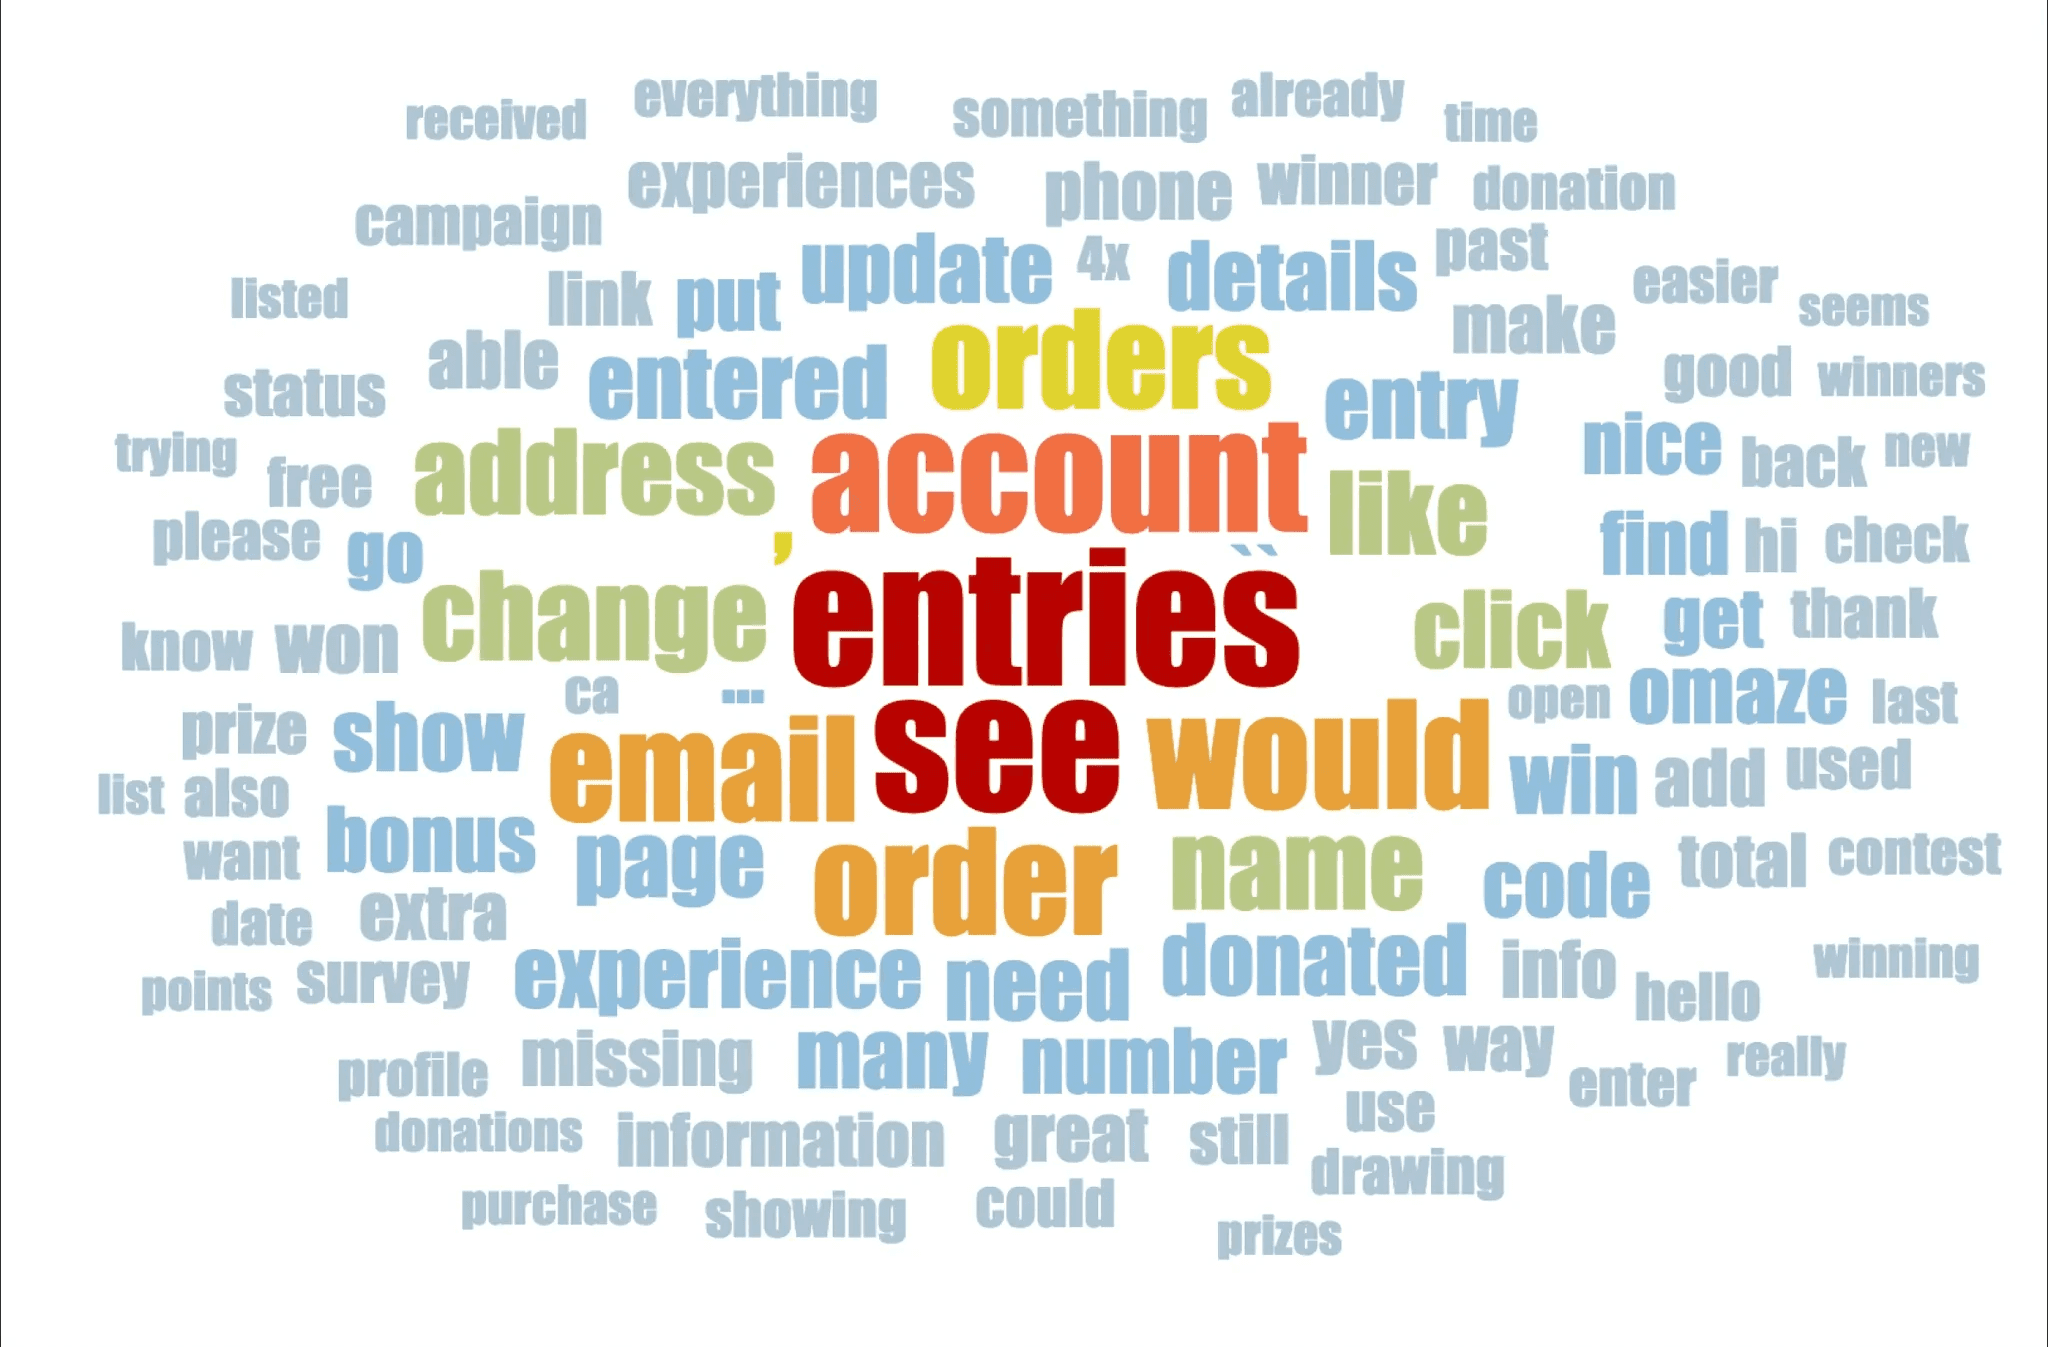
Word cloud insights from on-site account survey (via Hotjar). Entries were important, of course, but a surprise learning was that customers worried we couldn't contact them if they won if this information was incorrect.
“No idea how or where to track the status or results of the winner. It would be great if you could show the results on the same page where we see the campaigns we contributed to.”
Omaze Customer in 1:1 interview
Like the person above, most customers related lack of transparency to, "Is this a scam?"
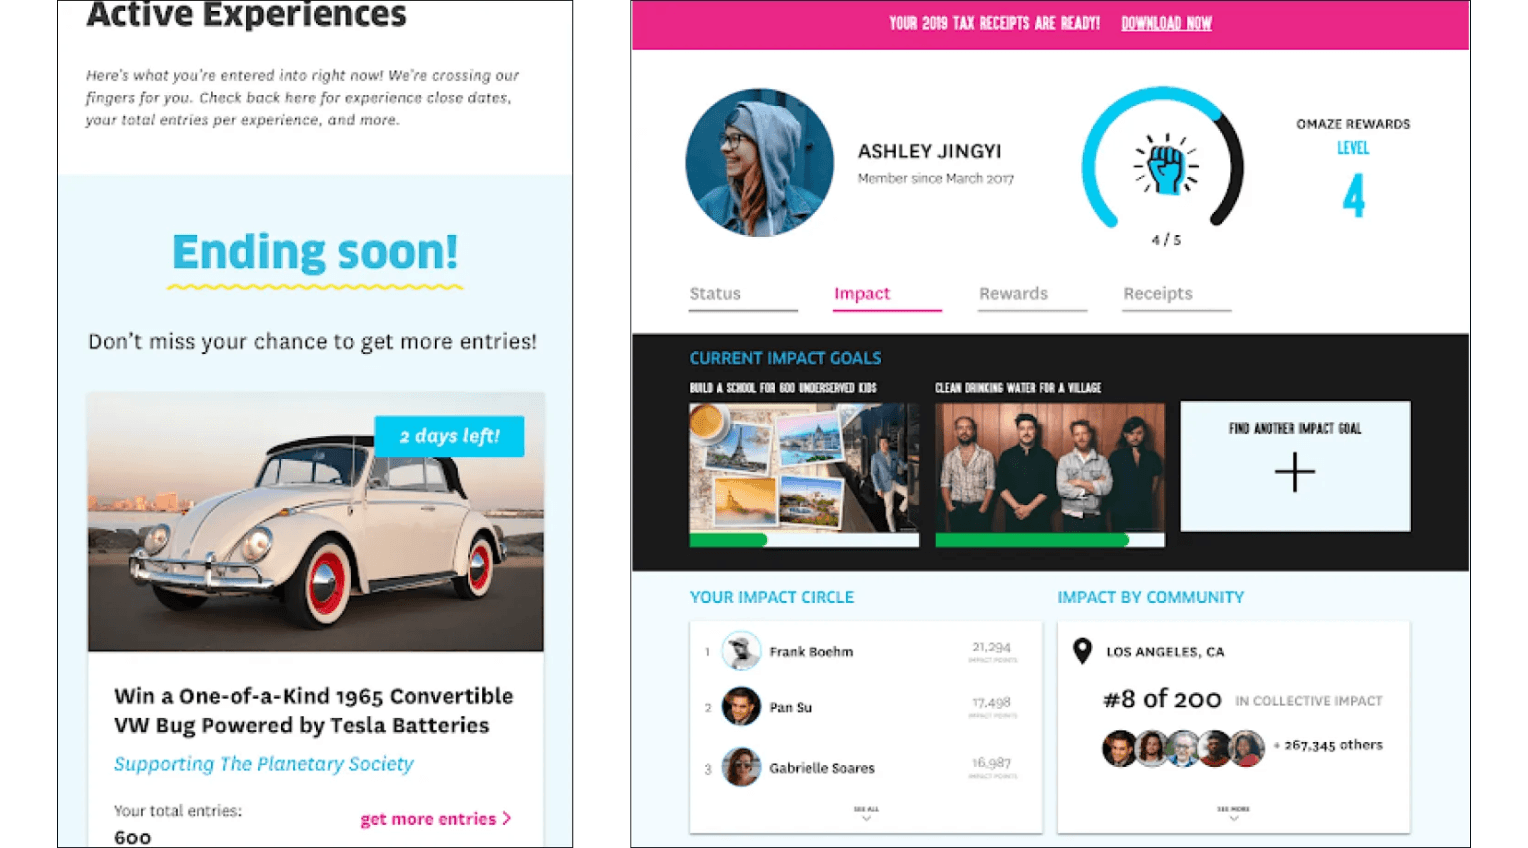
In a concept test, I was able to validate that future-vision features like leadership scoreboards around impact would bloat, vs. help, the experience. Giving them what they want now will work better.
Who I was designing for:
The Sweepstakes Enthusiast
Loves the thrill of winning big. Enters multiple sweepstakes regularly.
The Charitable Giver
Enters sweepstakes but values impact—wants their money to go toward a cause.
How might we …
Improve the transparency and usability of Omaze’s profile experience to foster customer trust, encourage repeat engagement, and reduce support inquiries?
Brainstorm and ideate
My design goals: Generate innovative ideas, ensure solutions aligned with user needs, and establish a clear direction for a phased release strategy.
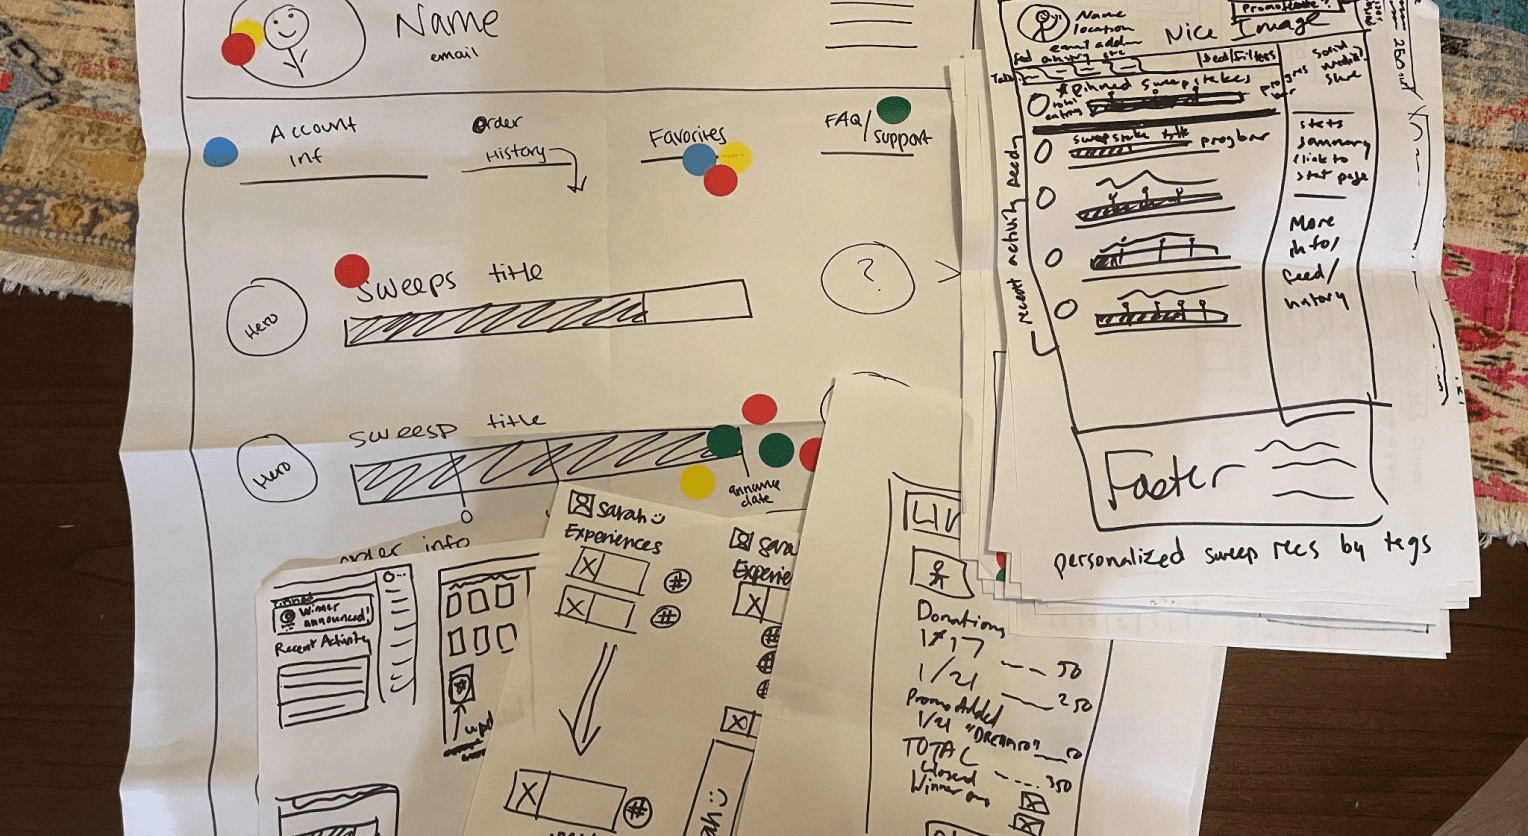
I first led a Crazy 8’s workshop to align cross-functional teams, fostering creativity and driving consensus around a shared vision for the redesign.
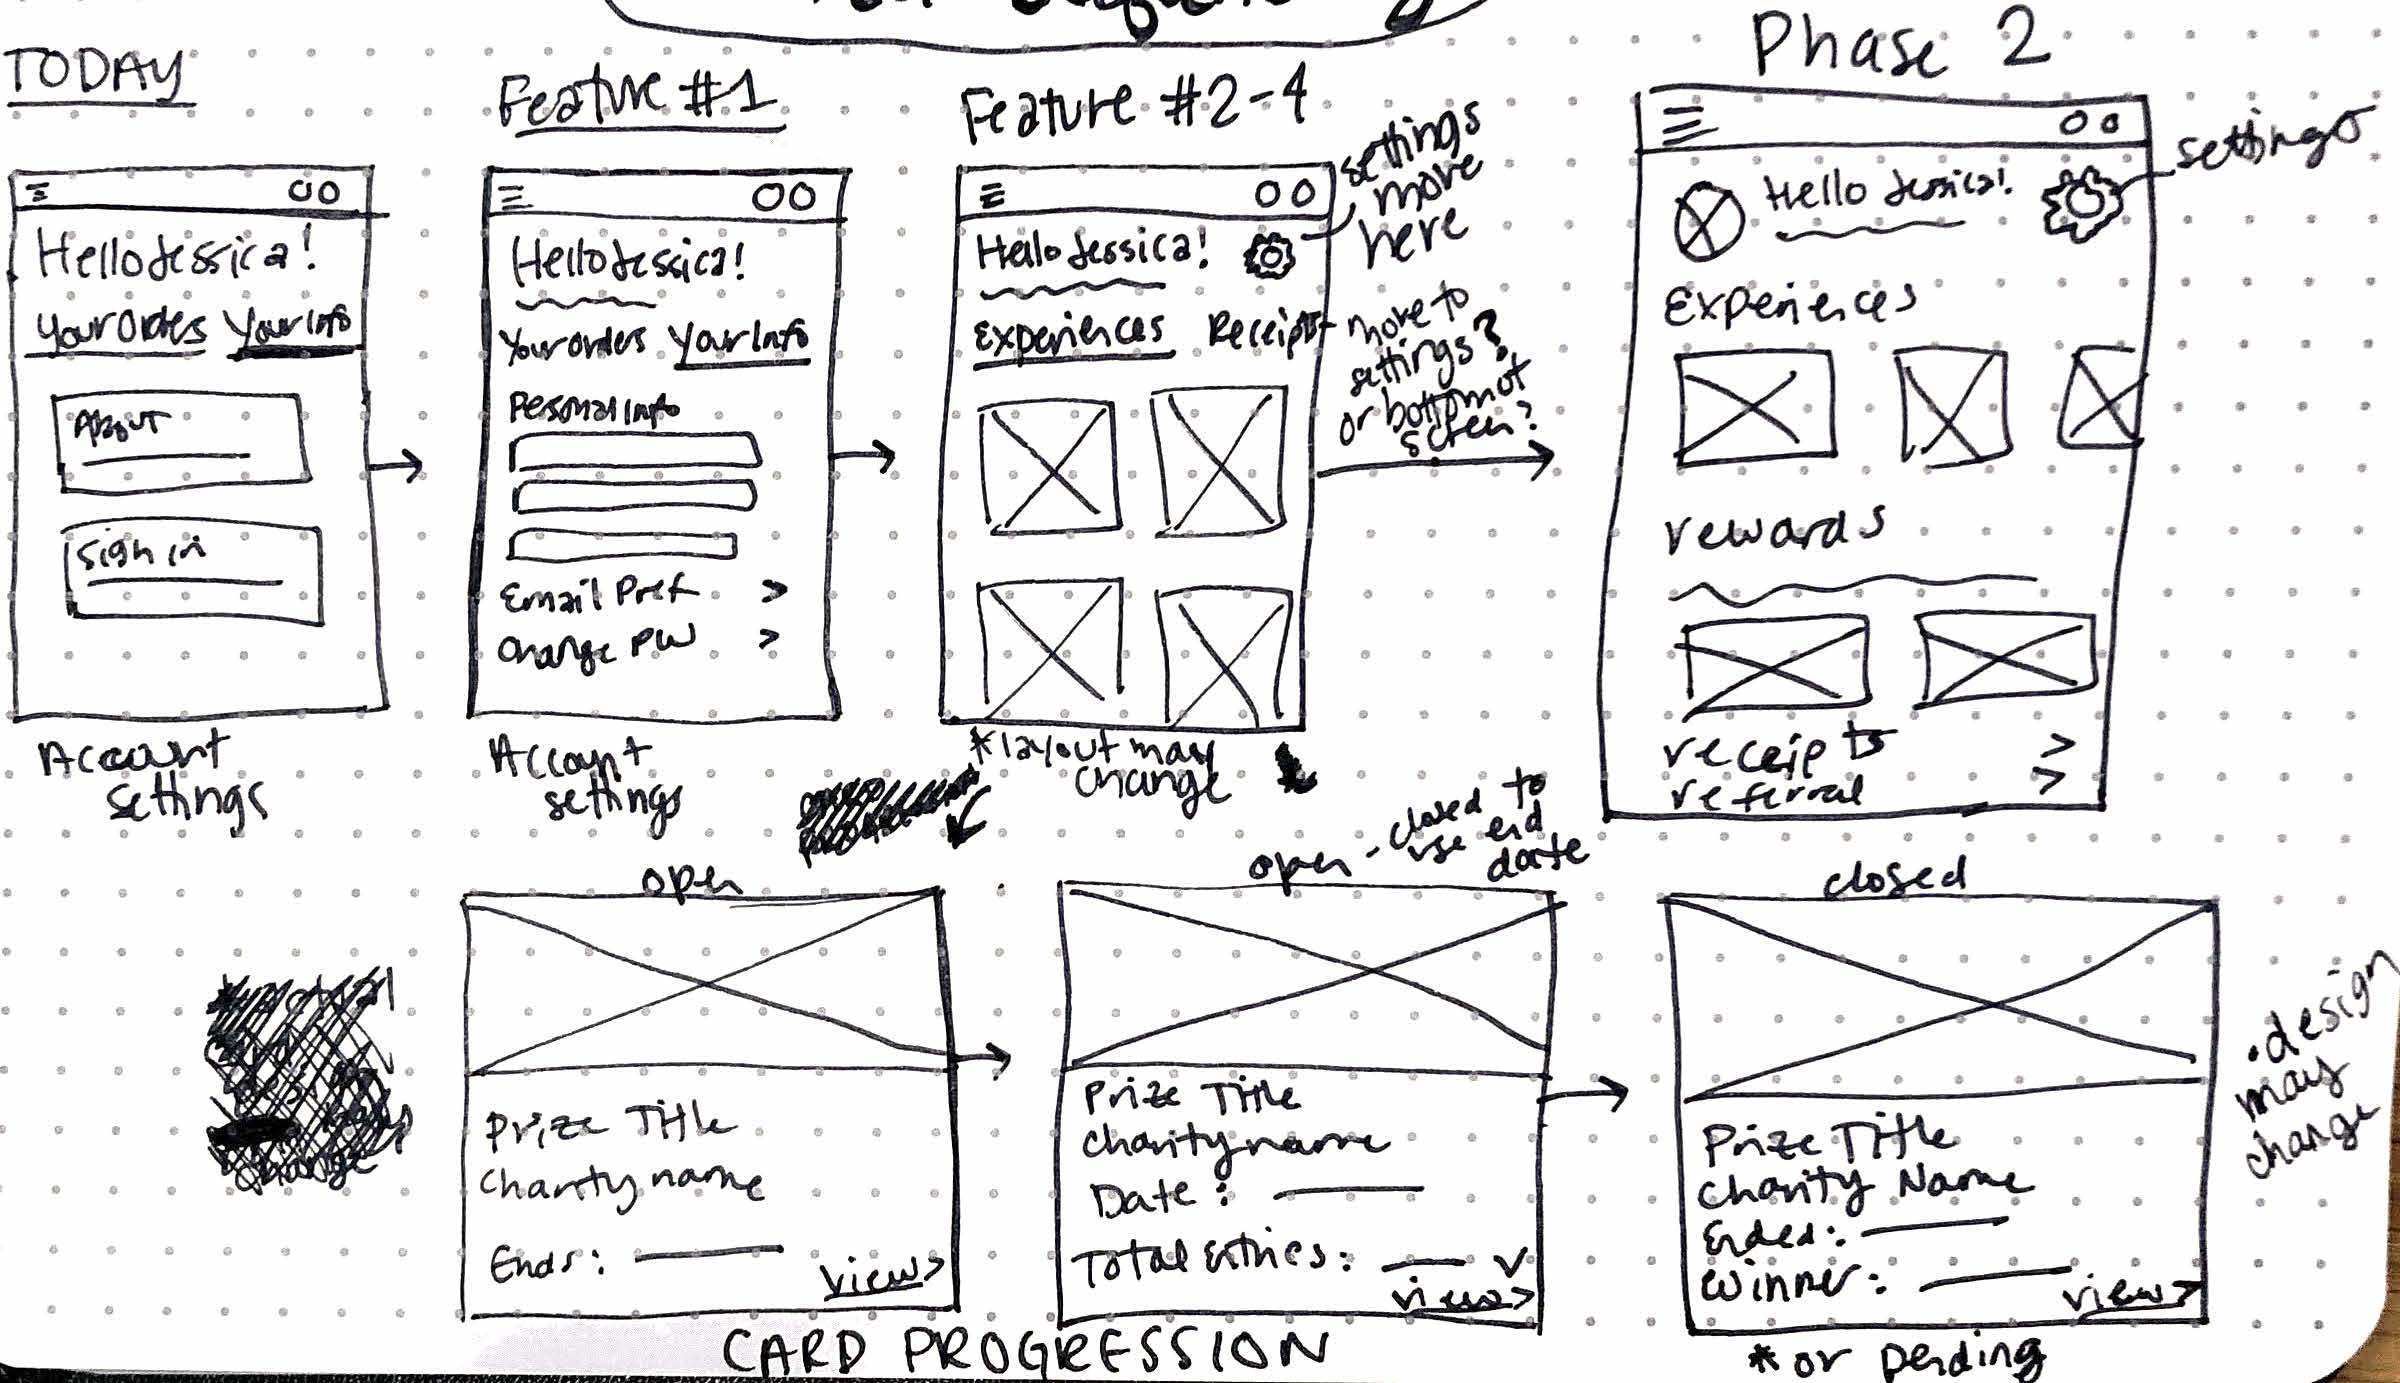
From there, I took those ideas and sketched, iterating on layouts and flows. I used these to work out a phased release strategy with engineers to ensure a seamless progression from concept to execution.
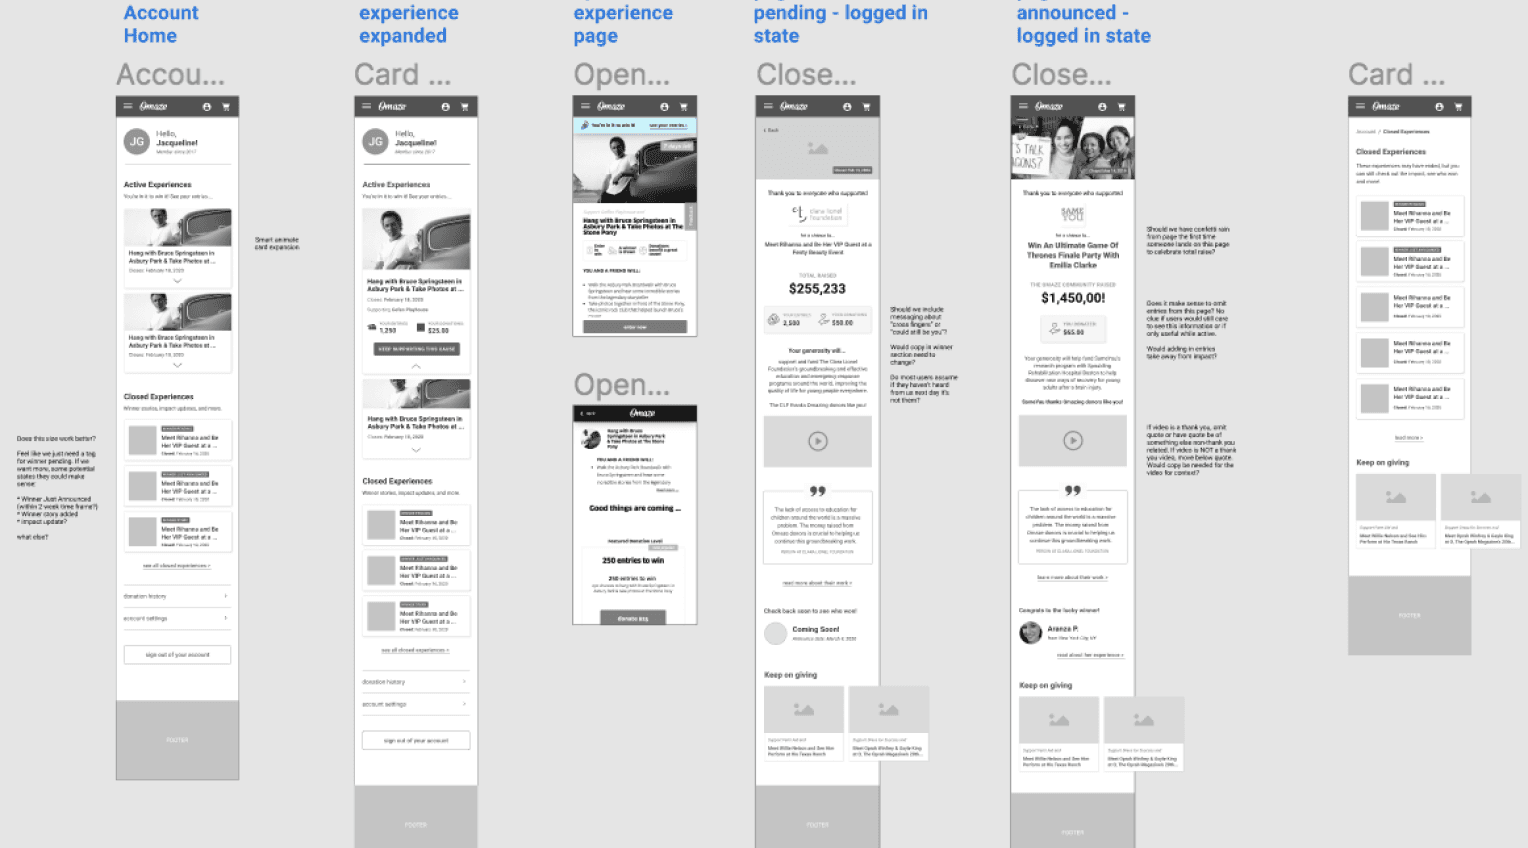
Serving as the blueprint for collaboration, I created wireframes to align my PM and engineering on the specifics of my approach, ensuring technical feasibility while maintaining focus on user needs.
The phased approach we aligned on:
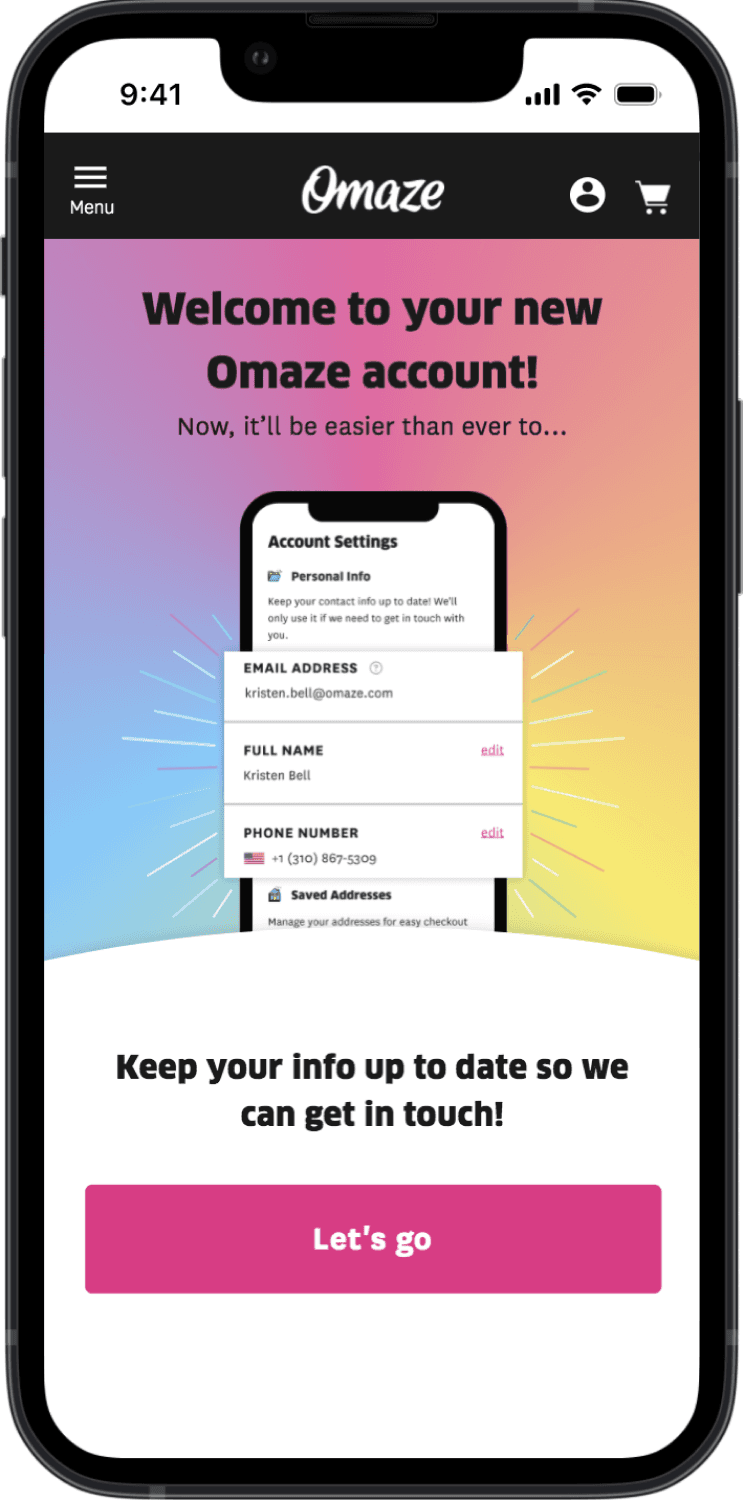
Release editable personal settings first and communicate the winner selection process.
Then, launch the new responsive dashboard showing orders by prize and end date.
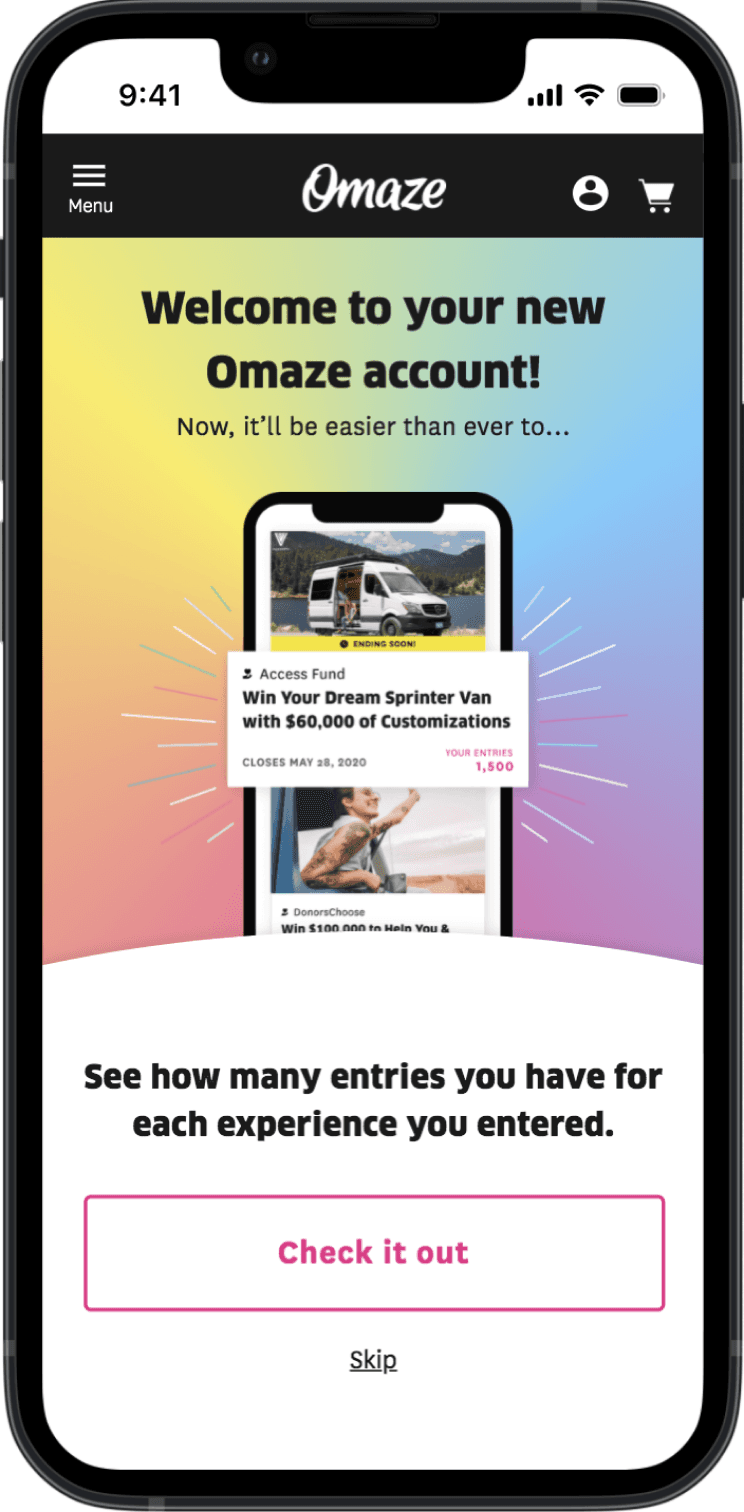
Last, show one's total entries per sweepstakes on each card, and announce updates to customers.
Gut-check with real customers
I designed, built and tested a quick prototype with six current customers to further validate the content and feature hierarchy.
I received overwhelmingly positive feedback on having total entries front and center and the overall dashboard organization. This just added more confidence to what we were building, helping keep the team motivated.
100% found the dashboard easy to use and that it met their expectations.
“Easy to navigate. Never had to extensively search to find any information.”
83% reported a significant increase in transparency and trust in Omaze.
Collaborate with engineering
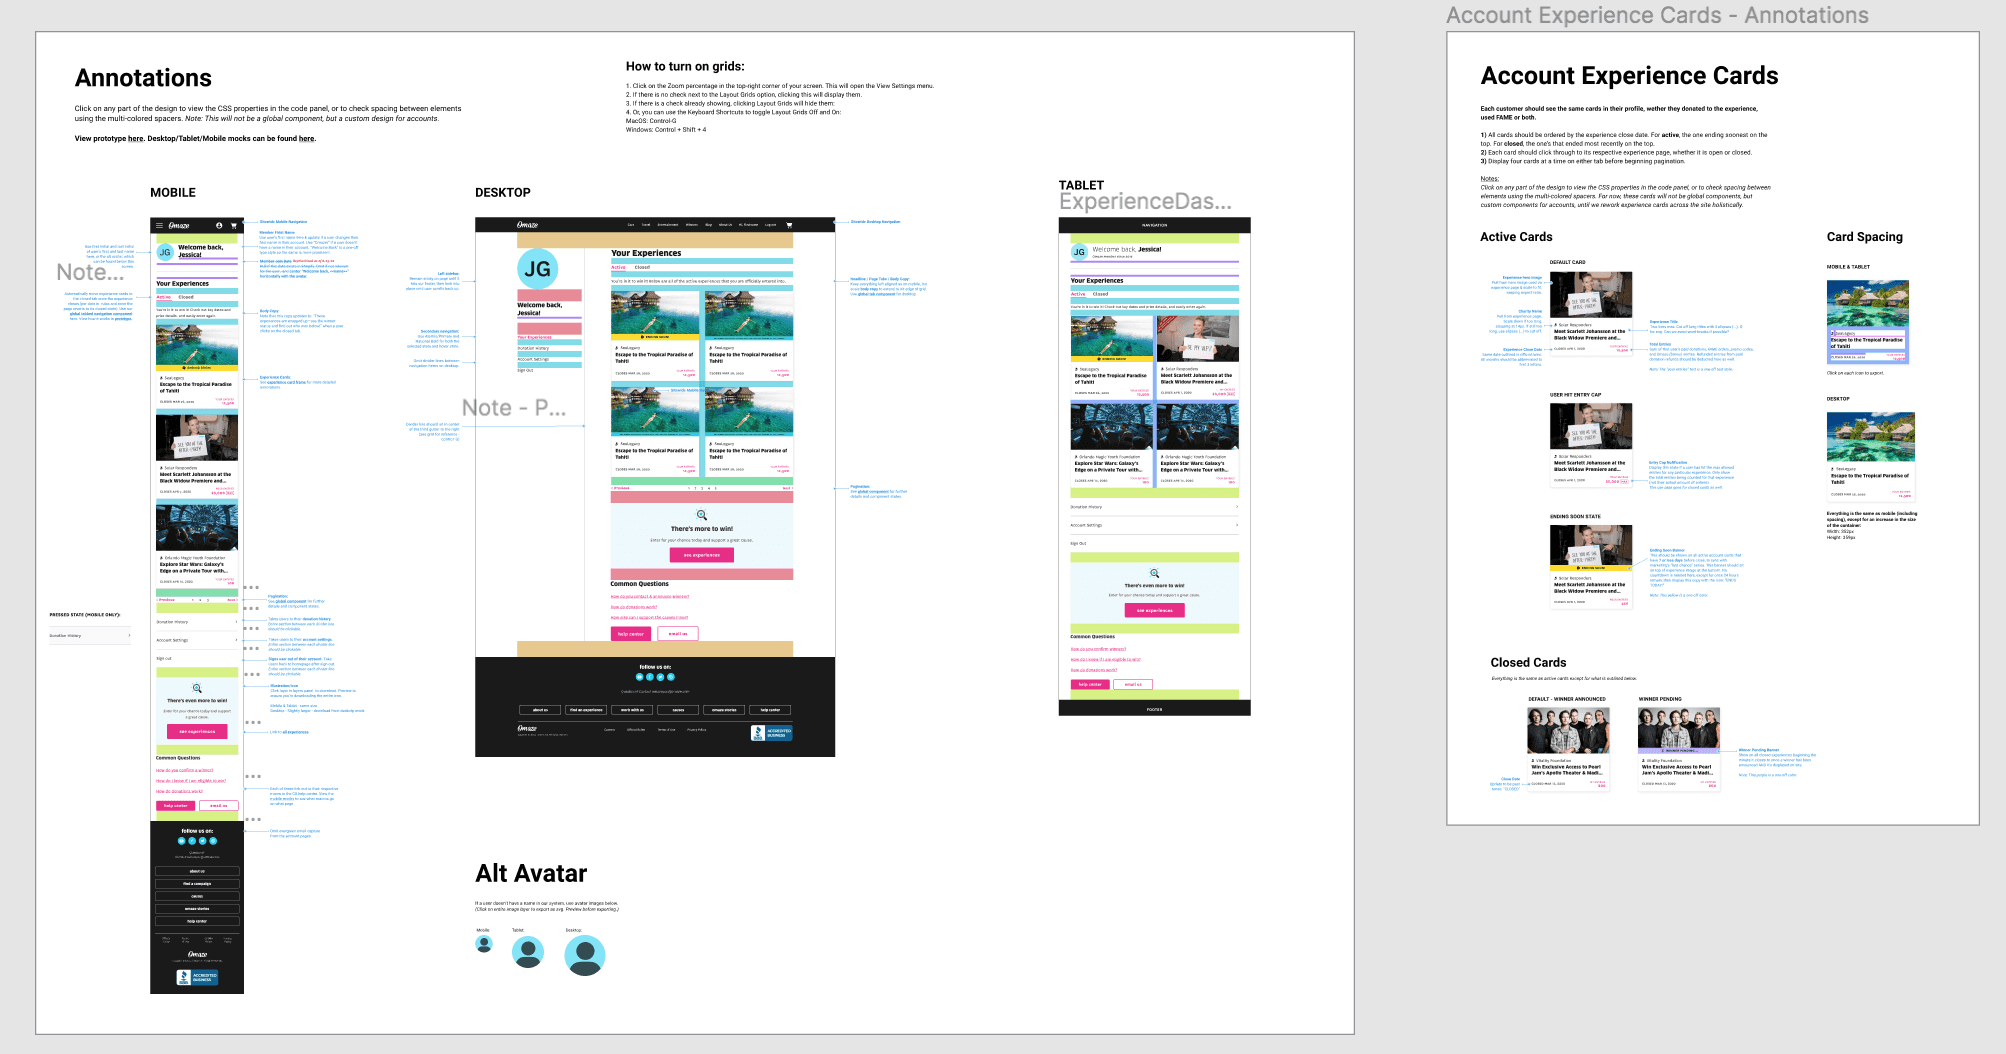
I used Figma to finalize all template layouts across breakpoints, starting with wireframe kits to save time and later refining the UI to match the current design system, as rebranding was out of scope.
I had just migrated the team to Figma from Sketch and was simultaneously defining the team's first real component library as they worked it into Storybook.
I collaborated closely with engineers, using mobile and desktop prototypes to clearly communicate user flows and interaction patterns, ensuring smooth implementation.
Highlights of the final thing
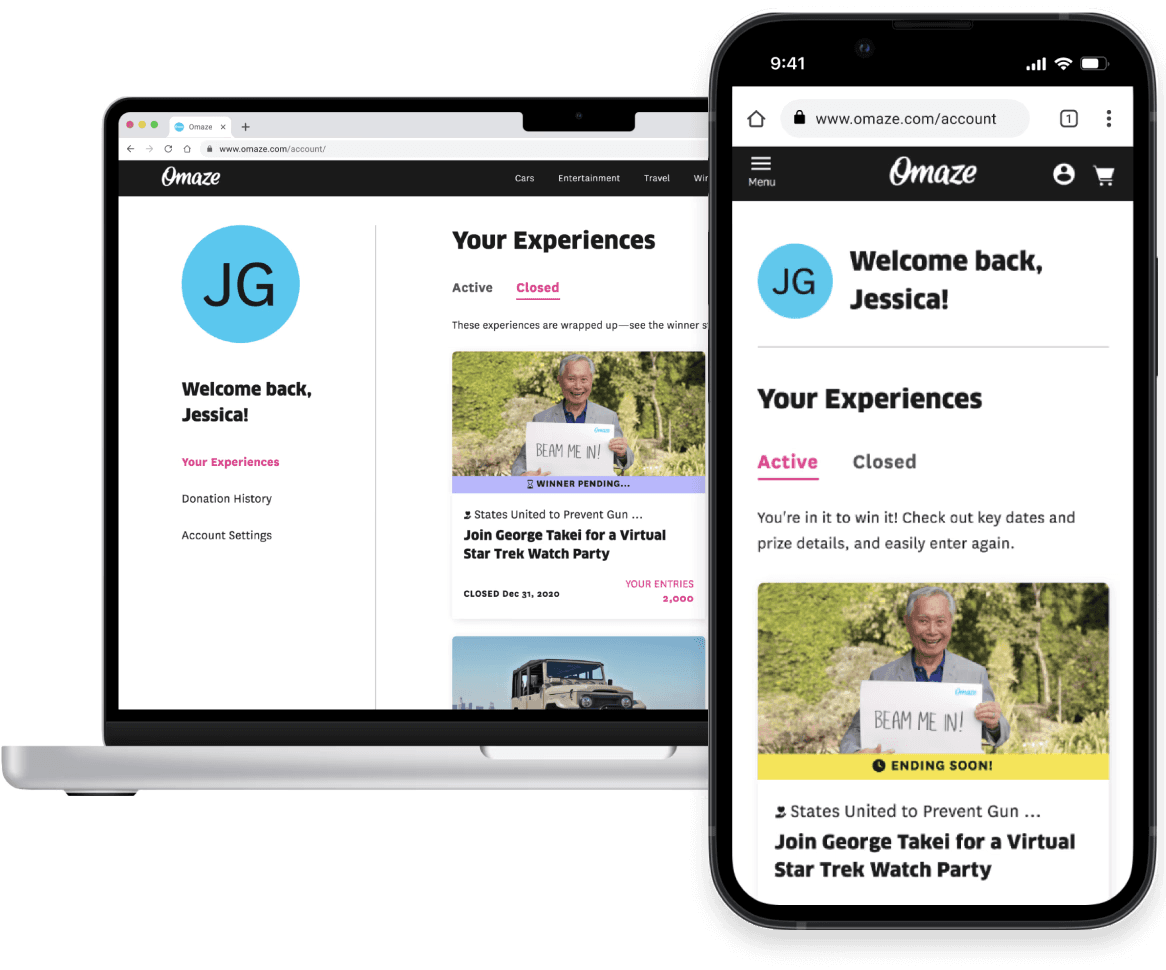
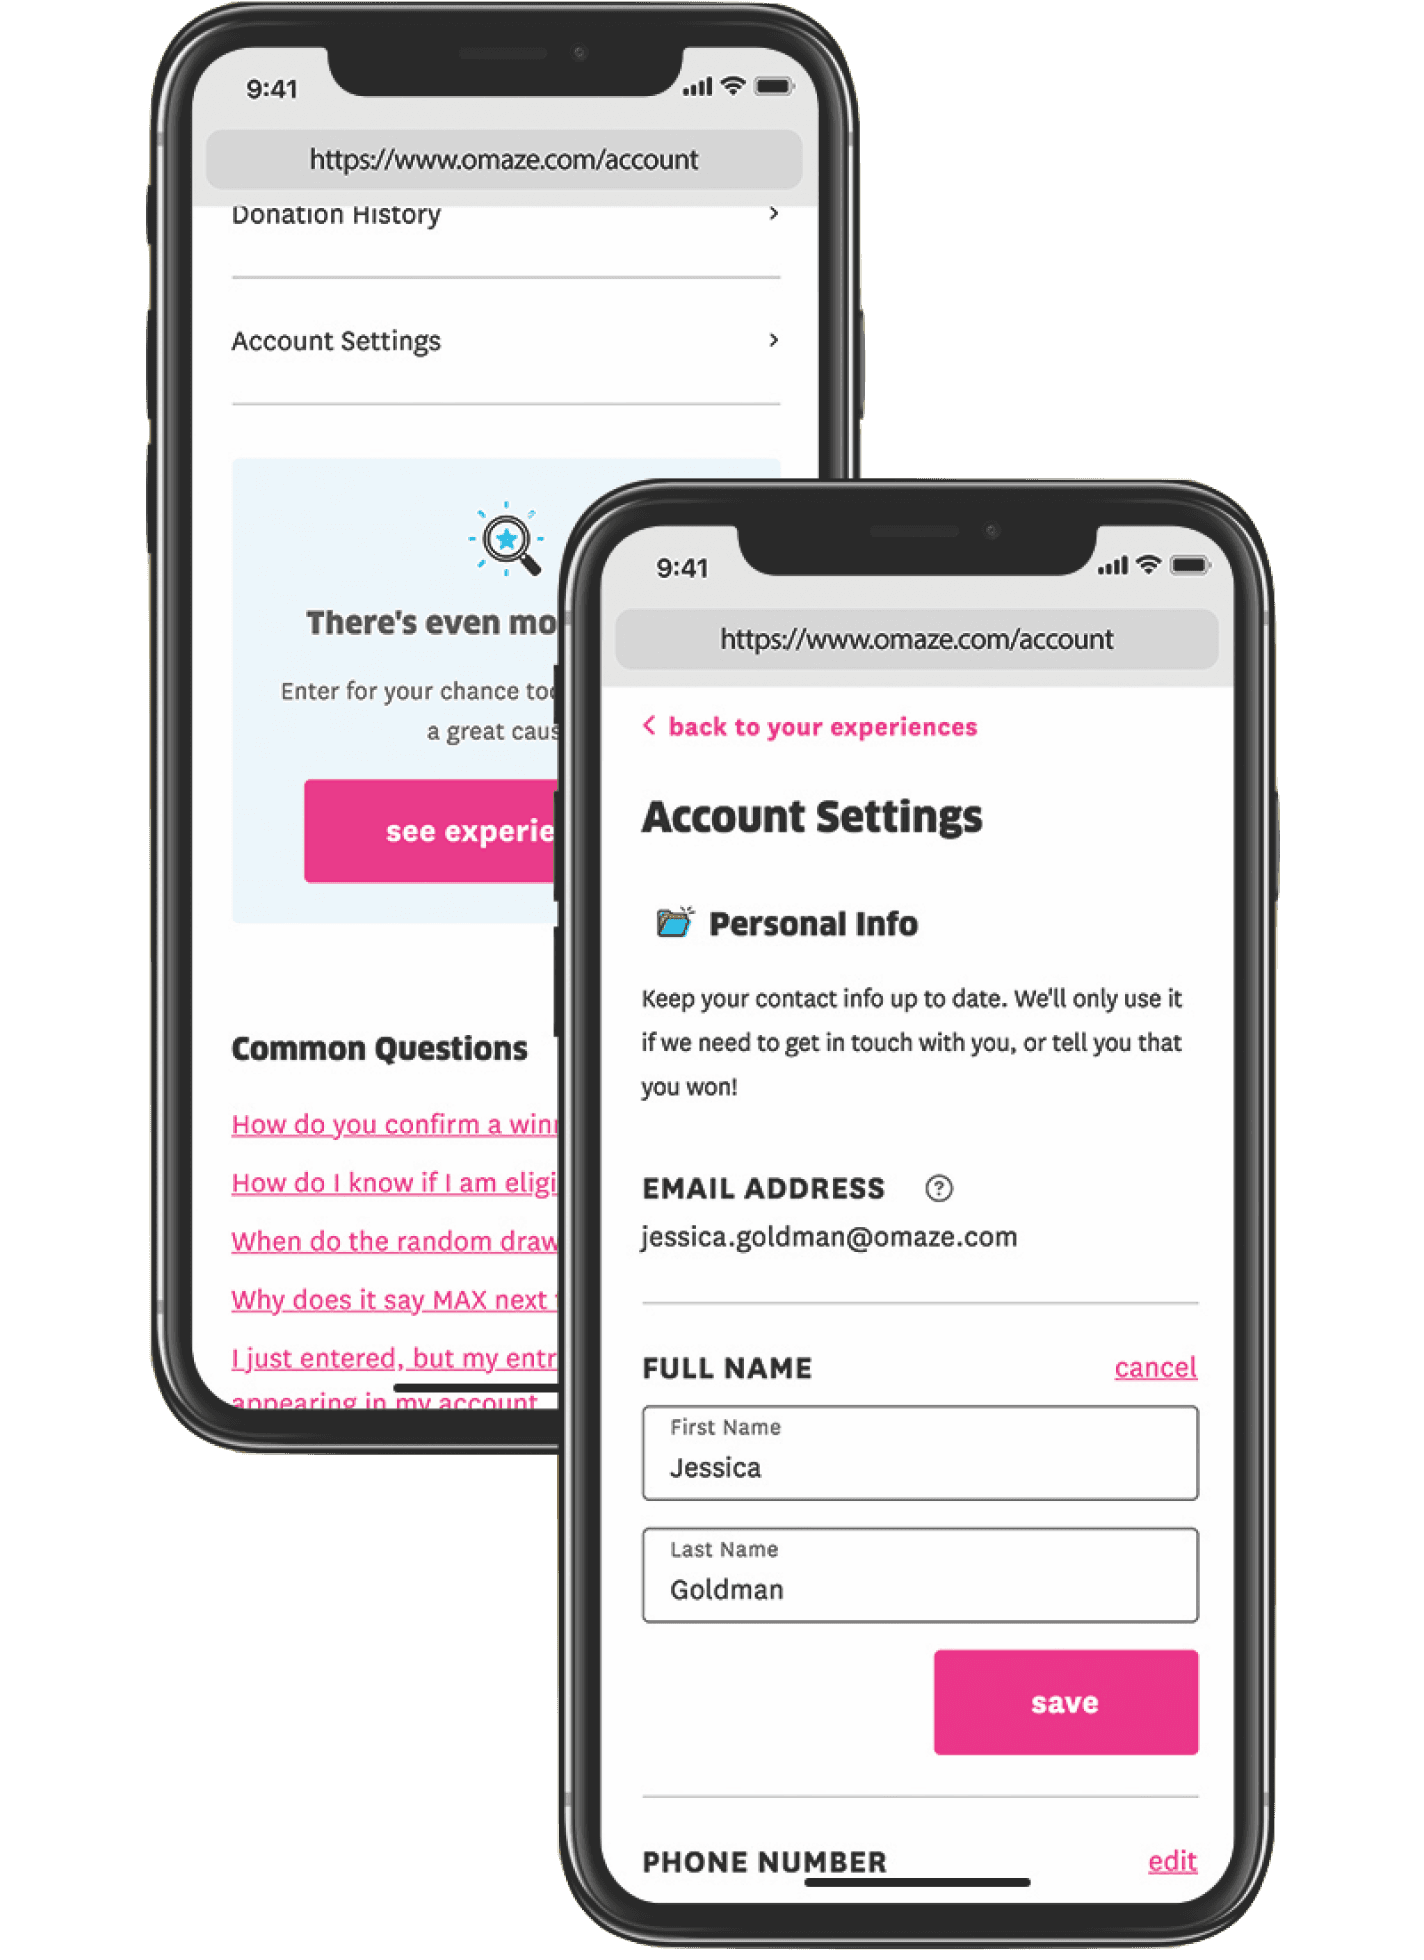
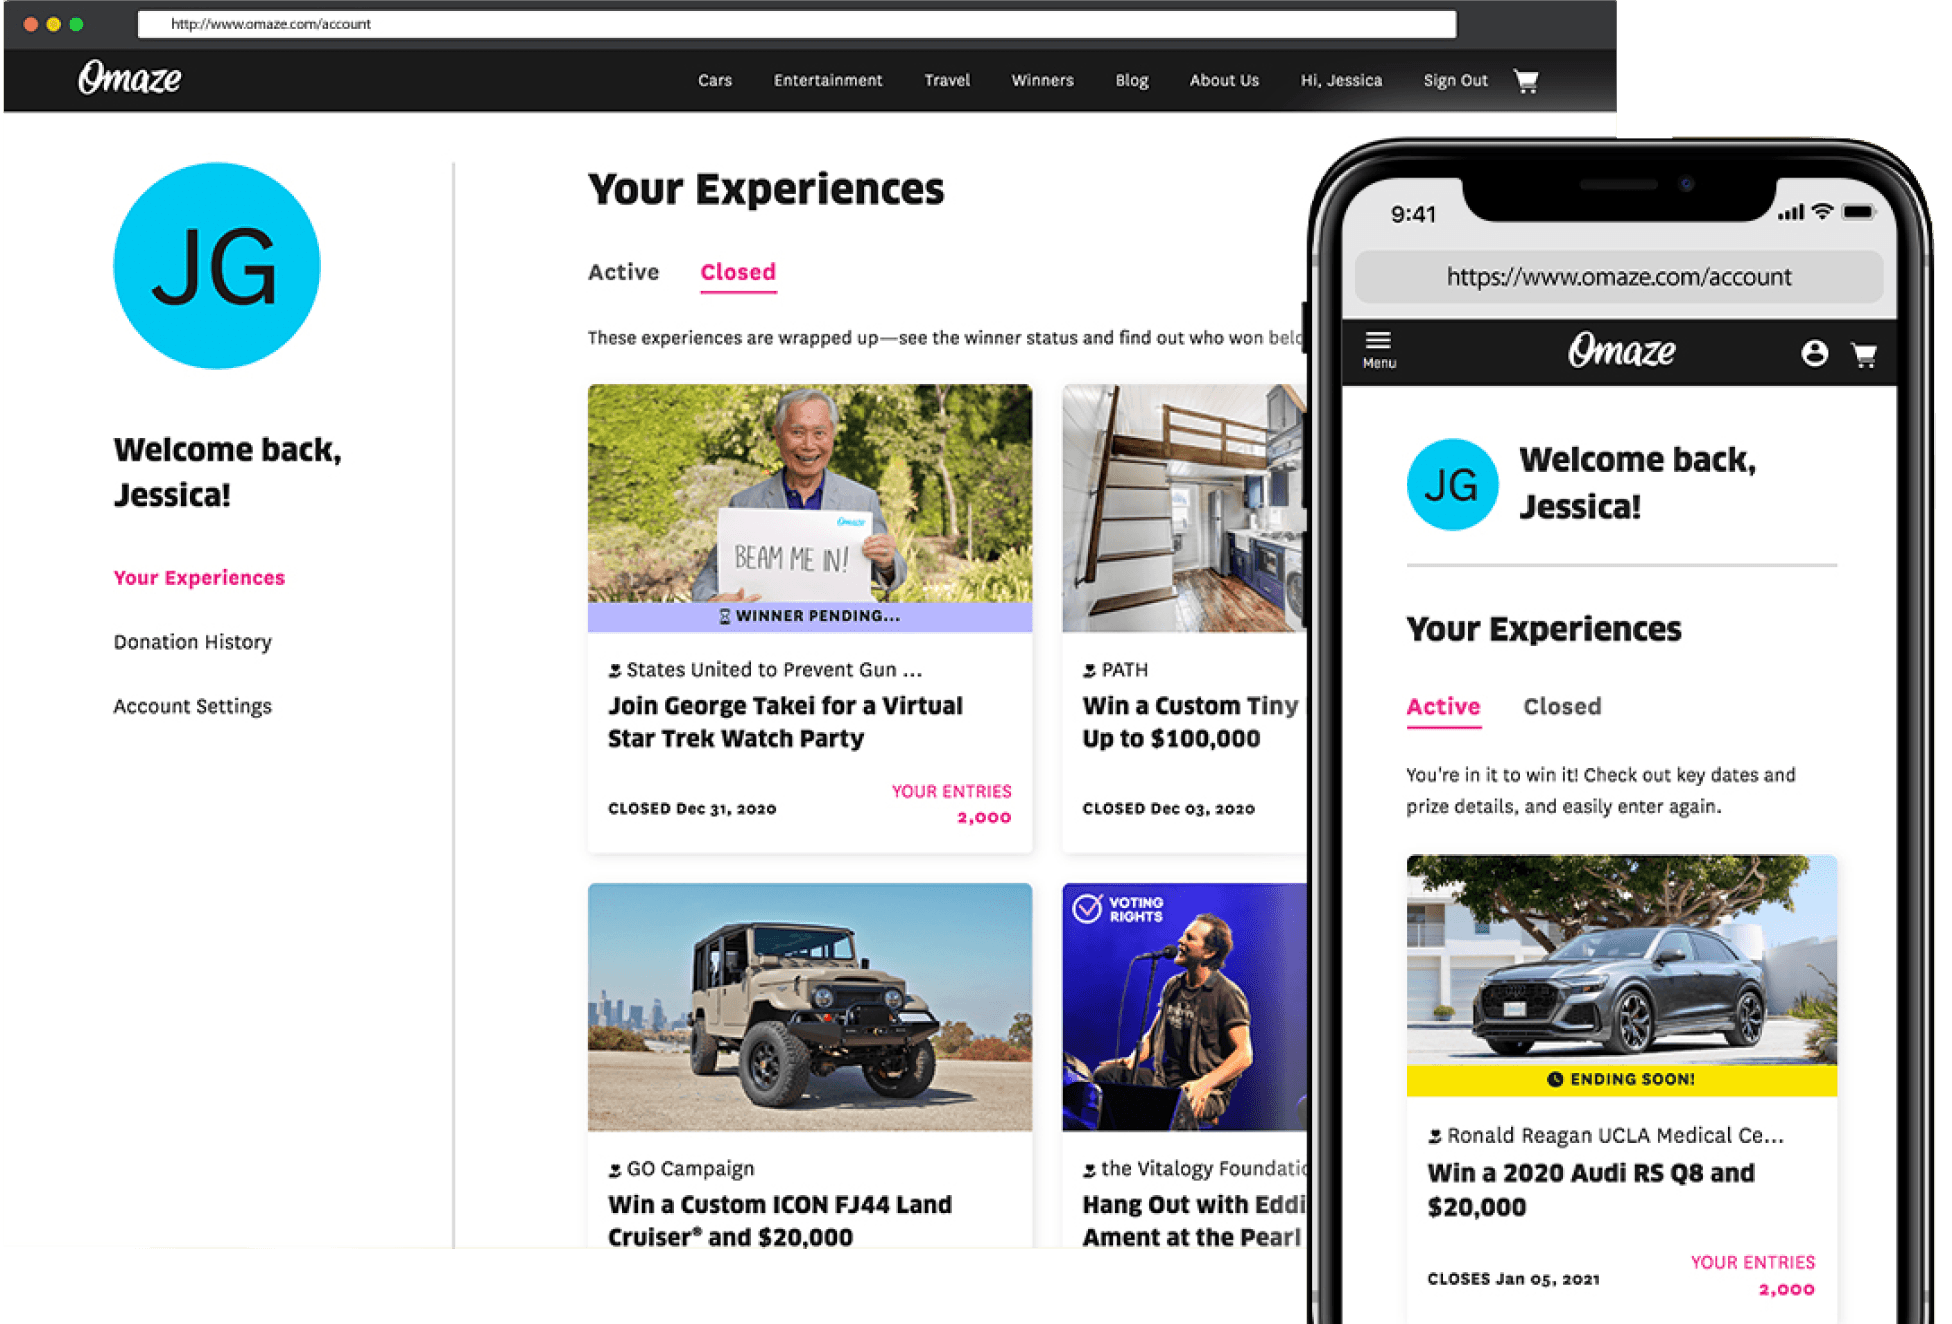
Editable account settings (name and phone number) and new pathways encourage users to enter more sweepstakes and explore additional Omaze offerings.
The profile dashboard MVP includes tabs for active and closed experiences, tags to display urgency and winner updates, and a prominent display of total entries.
Go to market feature launch
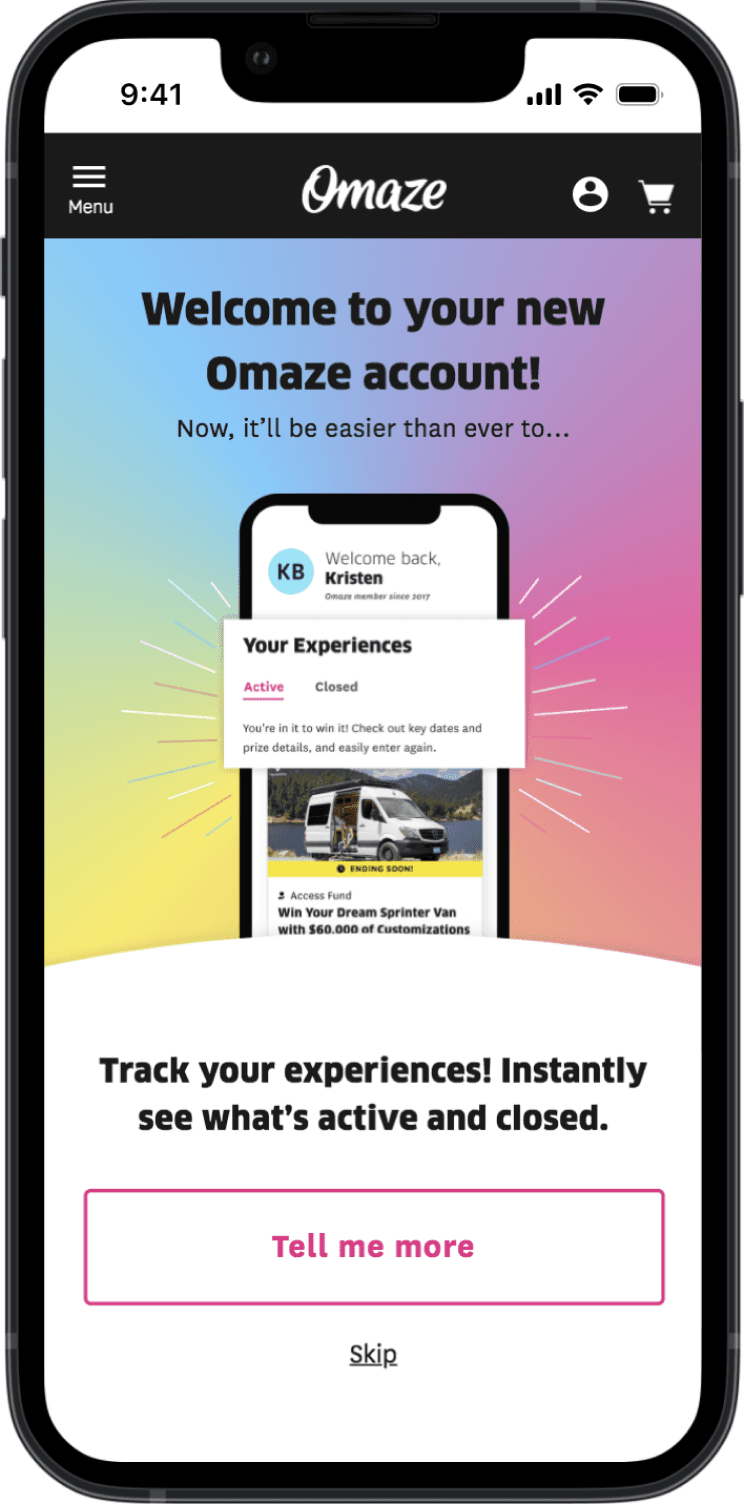
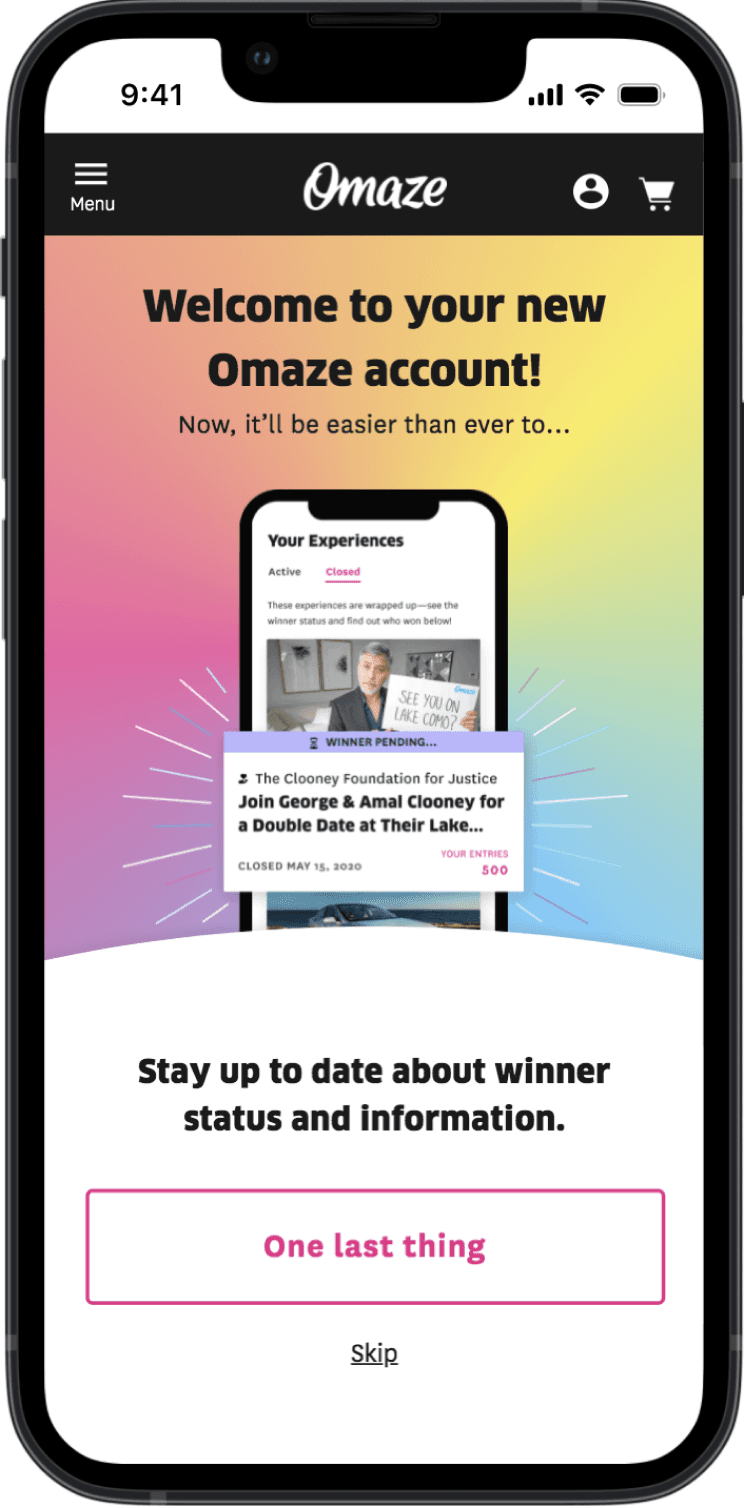
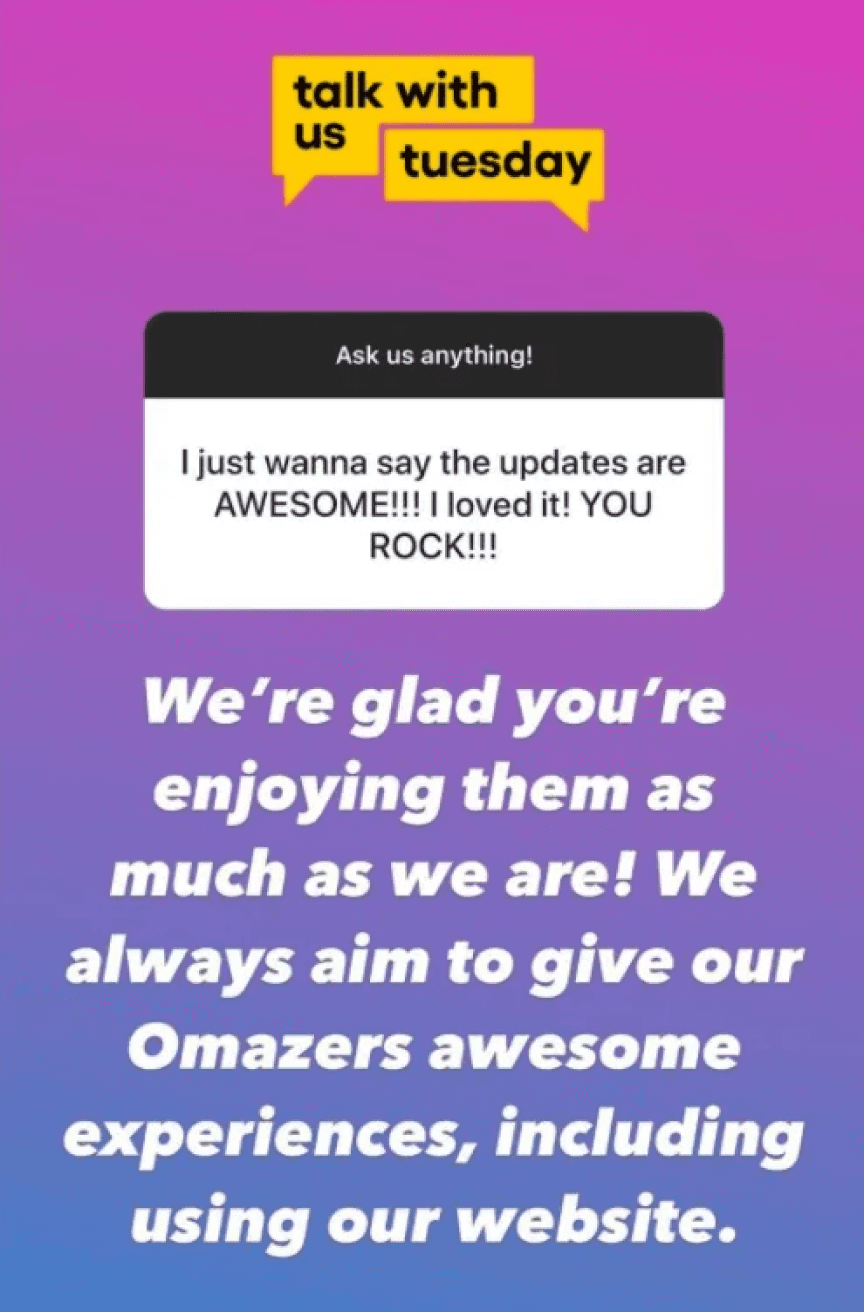
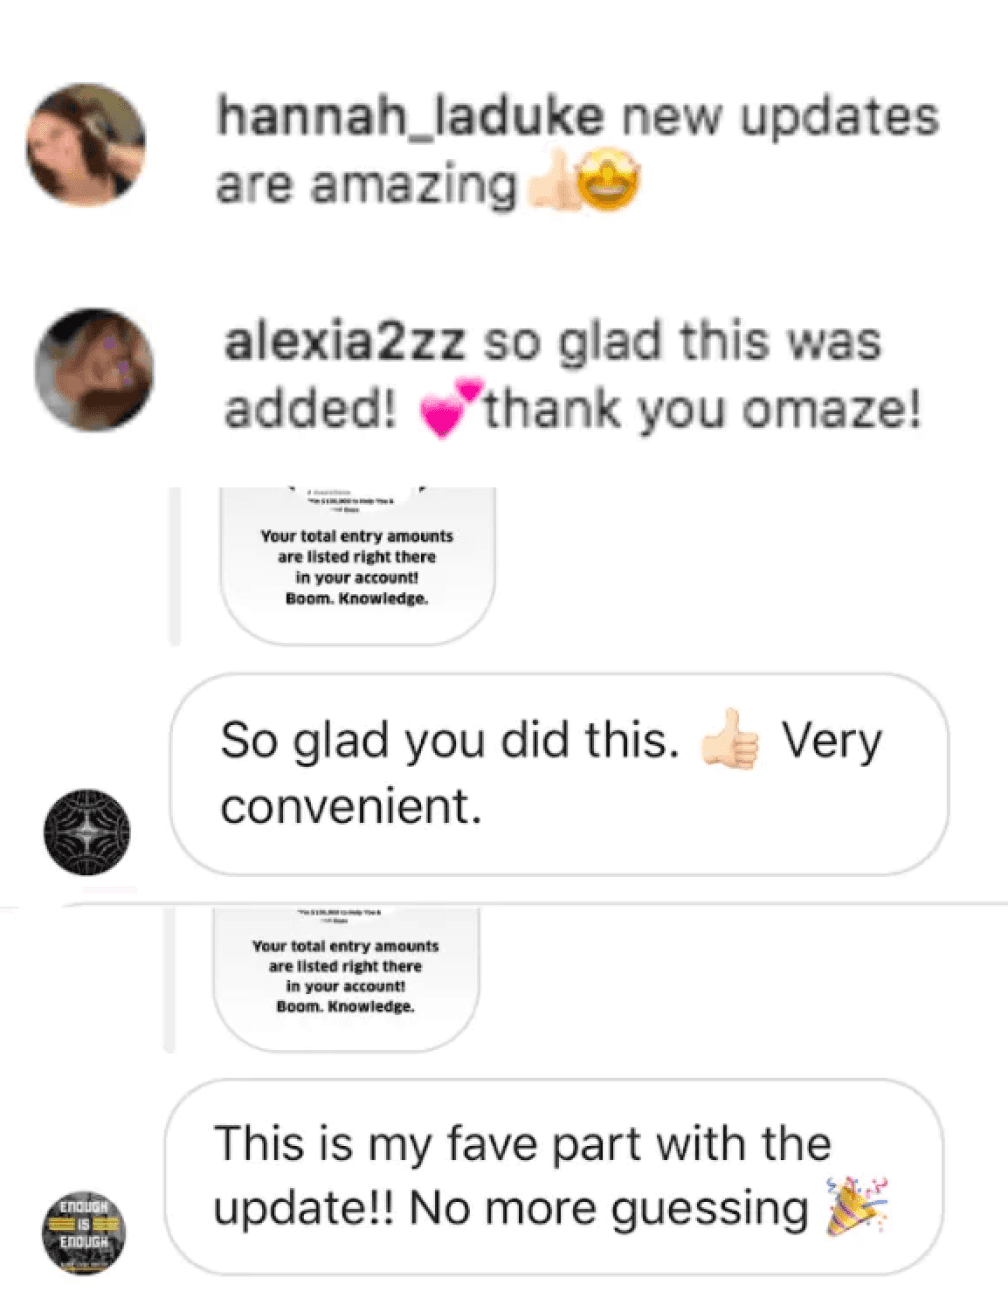
Our go-to-market team (me, our new design systems designer, our creative lead, and lifecycle marketing manager) promoted the feature across email and social media, as well as on-site onboarding to highlight the new updates. I provided expertise on profile design to ensure key points aligned with customer needs.
Analyze impact
Increase in revenue after two months.
+$580k
By designing and implementing a more transparent and user-friendly dashboard, I contributed to a $580k revenue increase within two months.
Increase in year-end order velocity
+20%
Order velocity rose from 1.23 to 1.47, reflecting higher user engagement and repeat participation.
Reduction in support tickets
-50%
Profile updates cut account-related support tickets by 50%, from 300 to 150 by year-end.
What happened next?
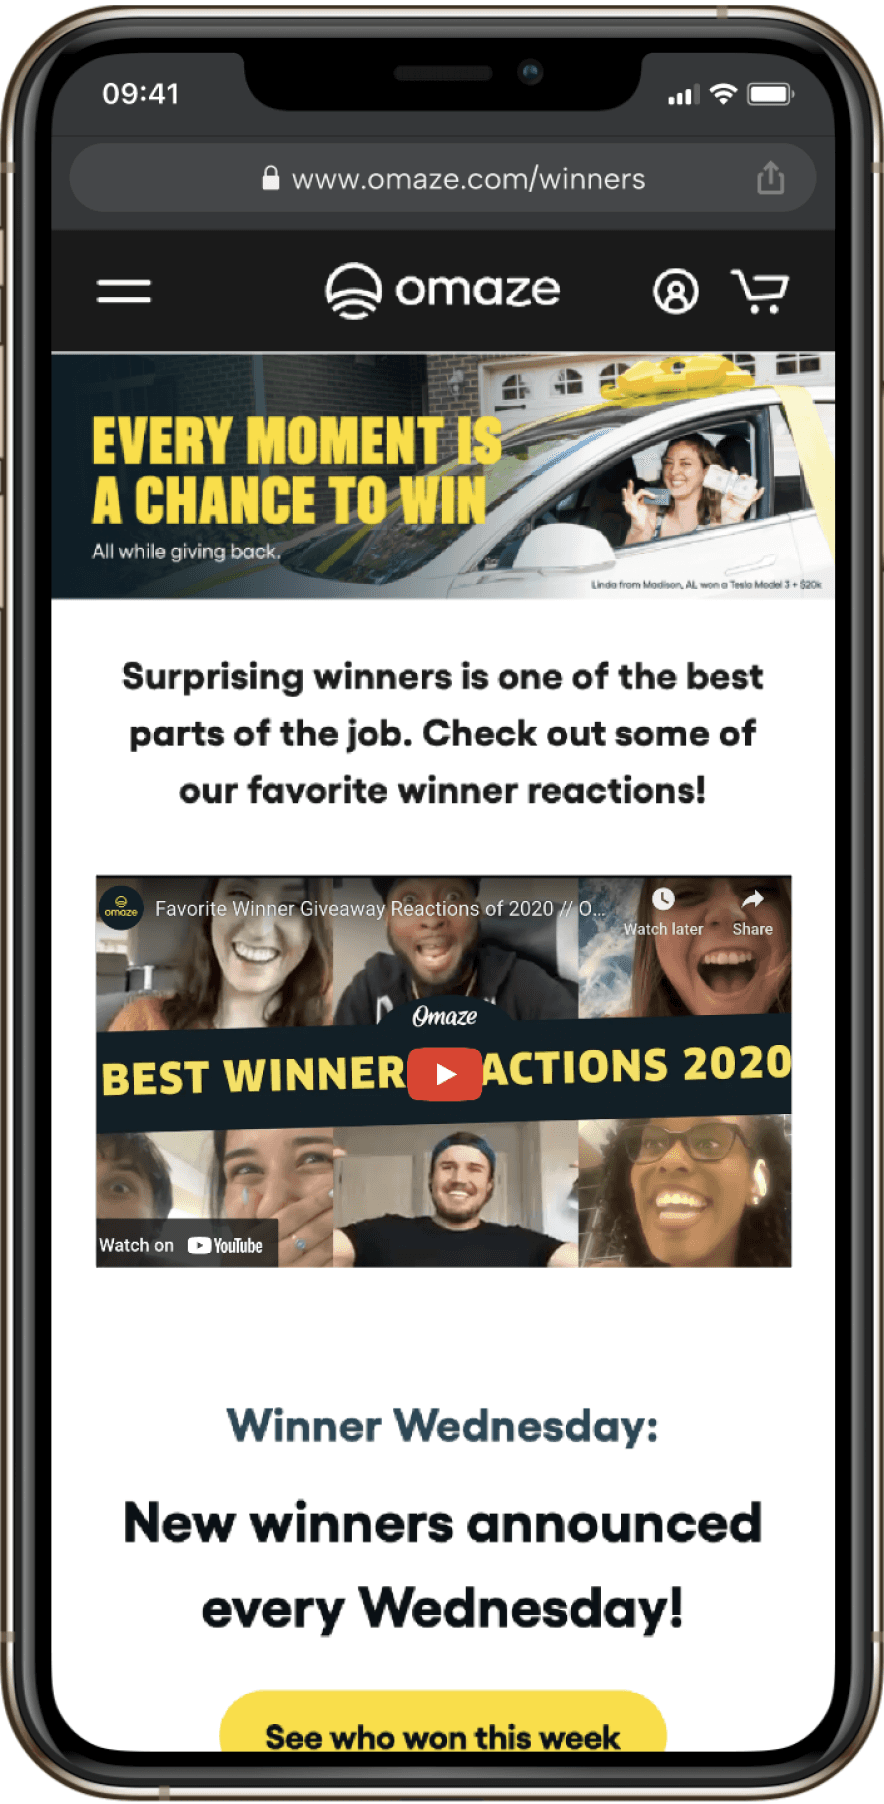
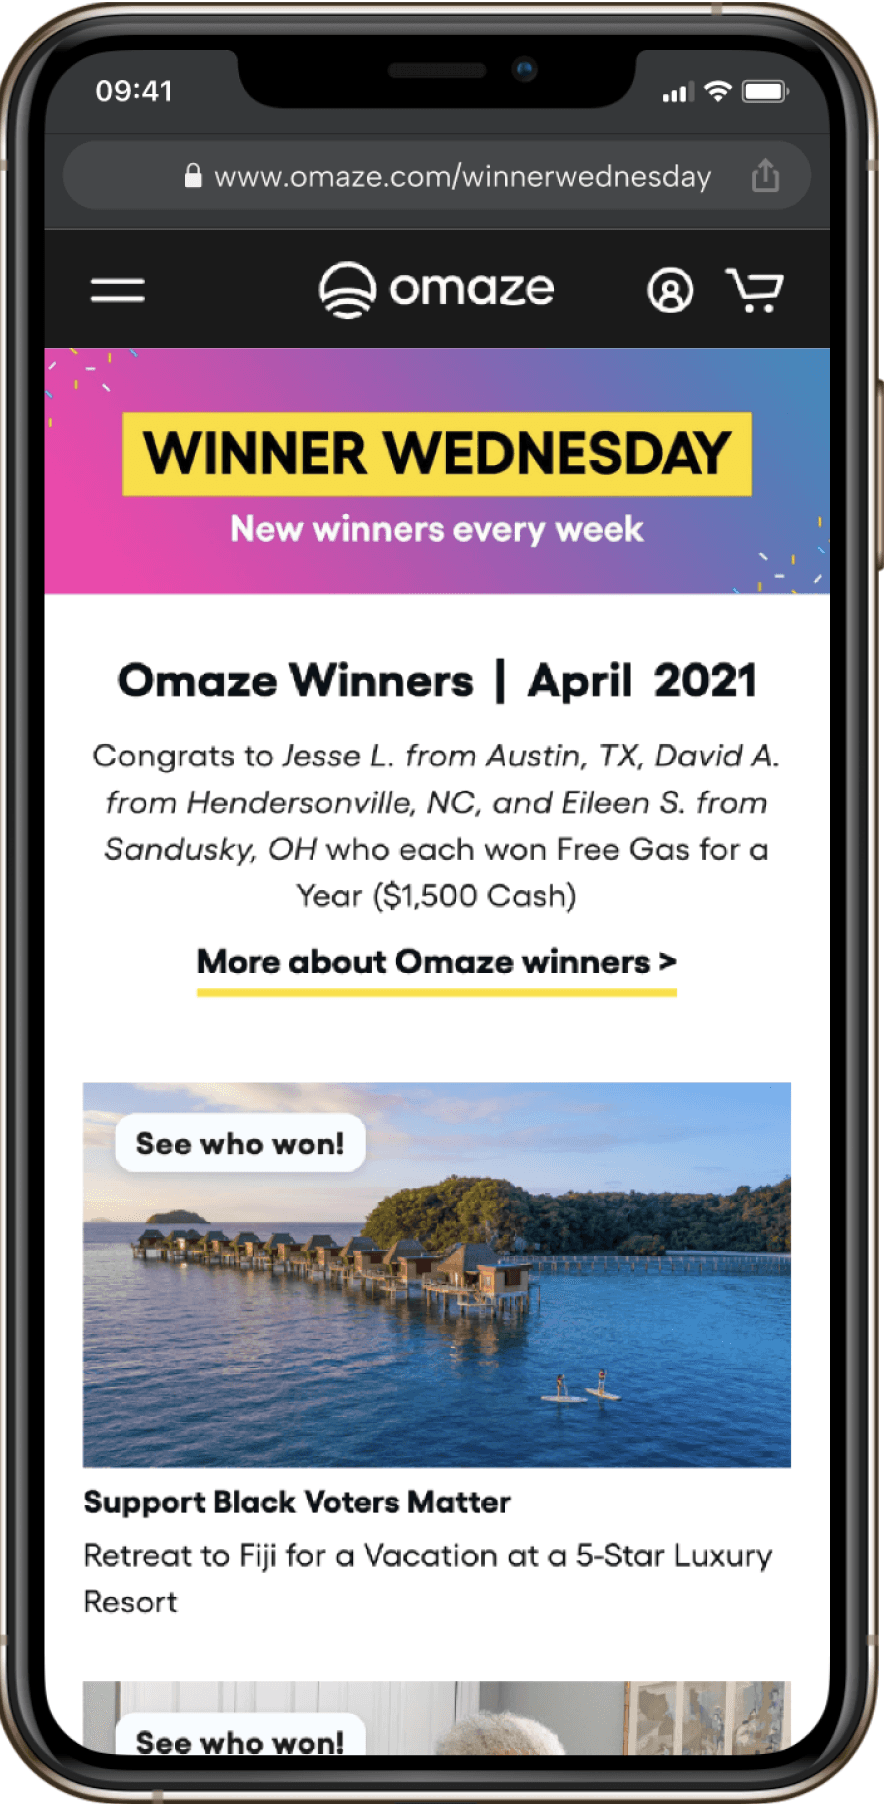
To boost trust and retention, I designed winner and impact pages directly on our core site—replacing scattered Squarespace and WordPress pages.
Built in Shopify and Sanity with no engineers, these pages showcased real winners and reinforced brand credibility.
in gross donation value in just 4 months.
+$120k
increase in checkouts
+34%
If this sounds like you
There's a page or flow nobody has touched in years, and you suspect it's costing you. Your budget is real, and every decision counts. I work with early-stage founders as a fractional founding designer: research, scope, design and a handoff your engineers can run with, at the level of involvement your budget allows.